Contents
- The Lifeline of Frozen Rivers
- The Challenge: Unpredictable Ice Dynamics
- Community Impact: The Subsistence Crisis
- Integrating Spatial Data and Local Knowledge
- Implementation: Developing the Ice Mapping Tool
- Results: Enhancing Safety and Adaptation
- Scope and Limitations of Satellite Monitoring
- Conclusion and Key Takeaways
The Lifeline of Frozen Rivers
For communities across the Yukon-Kuskokwim Delta, frozen rivers are not scenery. They are roads.
When the channels lock up in autumn, they become the primary corridors for moving between villages, reaching trapping grounds, and hauling supplies that would otherwise arrive only by air at considerable cost. These networks typically span roughly 300 to 450 miles during peak winter months, threading together settlements that sit far apart on the open tundra.
The trouble is that the rivers no longer freeze on the old schedule. Historical freeze-up baselines, established from records spanning mid-October to early November across the 1980 to 2010 period, described a window that hunters could plan around. That window has shifted, and the consequences ripple through every winter activity that depends on solid ice.
This case study examines a specific intervention: how Synthetic Aperture Radar imagery and community-based monitoring were combined to restore safer subsistence access. Researchers began by overlaying historical winter trail networks against recent satellite imagery, isolating the intersection points where ice failure recurs most often. Those failure points became the focus of everything that followed.
The Challenge: Unpredictable Ice Dynamics
The environmental shift has three distinct signatures: later autumn freeze-ups, earlier spring break-ups, and a newer phenomenon — mid-winter thaw events that now occur frequently between late December and mid-January, lasting three to seven days. A river that should be at its most stable in the deep of winter can briefly behave like it is March.
Each of these patterns produces its own physical danger.
The Hazard Categories
The team classified ice hazards by analyzing thermal anomalies in river channels, concentrating on areas where groundwater upwelling prevents solid freezing. Three failure modes dominate:
- Open-water leads: Channels that never fully close, often hidden beneath drifting snow, where springs or current keep the water moving.
- Aufeis (overflow): Water forced up through cracks that then freezes in stacked sheets. These overflow layers can accumulate to depths of roughly 12 to 36 inches over existing shell ice, creating a deceptively thick surface that conceals weakness beneath.
- Shell ice: A structurally compromised crust left when the water level drops away from a frozen surface, leaving an air gap underneath.
Traditional ecological knowledge remains the backbone of safe travel here. Elders read snow color, listen to the ice, and remember where springs have always run. But that knowledge was calibrated against a climate that is now departing from its own record. When freeze-up arrives six weeks late and a thaw cuts through January, the inherited baselines describe a river that no longer exists. The knowledge is not wrong; the conditions it was built on are changing faster than any single lifetime of observation can track.
Community Impact: The Subsistence Crisis
Delayed freeze-up pushes the start of safe river travel from early November to late December or even early January. That delay lands directly on the calendar of subsistence harvest.
Field coordinators documented the disruption by tracking how late winter fish traps were deployed and how often inter-village supply sleds had to reroute. The pattern was consistent: hunting and fishing grounds that families reached reliably in early winter became inaccessible for weeks, compressing the harvest season and tightening food security in places where the grocery store is a bush plane away.
Isolation compounds the problem. When an ice road is unsafe, the detour around compromised ice can add roughly 15 to 40 miles to a standard inter-village supply route. That is fuel, daylight, and risk, multiplied across every trip a community needs to make through the season.
Then there is the human cost. Routine travel over questionable ice means lost snowmobiles, lost gear, and in the worst cases, lost lives. The danger is not exotic. It arrives during an ordinary trip to check a net.
The Solution: Integrating Spatial Data and Local Knowledge
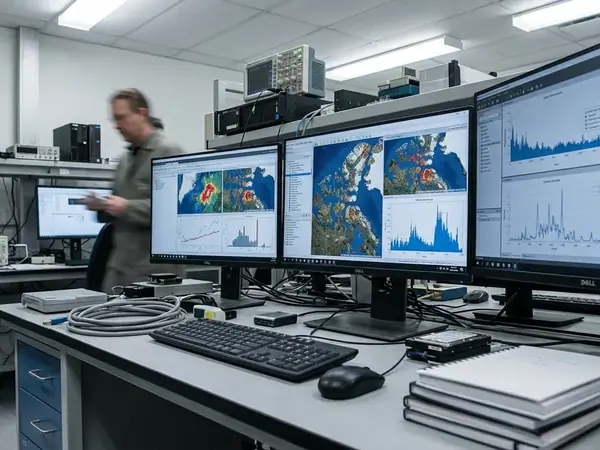
The research team built the monitoring system around Synthetic Aperture Radar rather than optical satellite imagery. The reasoning was straightforward: optical sensors are rendered useless by the extended polar night and persistent cloud cover. SAR sees through both.
SAR imagery is acquired at C-band frequencies of about 5.4 GHz, which penetrate dry snow and interact directly with the ice-water interface. That interaction is what makes the difference. Open water, solid ice, and overflow each return the radar signal differently, and those differences can be read as a map of surface conditions. Satellite passes deliver new data swaths every 6 to 12 days, depending on the orbital track.
Pairing Pixels with Ground Truth
Satellite data alone does not keep anyone safe. The methodology pairs each radar swath with on-the-ground observations from local hunters and environmental coordinators who know which anomalies are genuine hazards and which are artifacts.
Raw backscatter values mean nothing to a family planning a trip. So the synthesis process translates the classified radar returns into plain hazard maps: safe corridors, marked open-water leads, and zones flagged for overflow. The objective was always a product a person could read at a glance before leaving the village, not a dataset for an analyst.
Implementation: Developing the Ice Mapping Tool
Remote Alaskan villages run on edge networks. Any tool that assumed broadband would fail on arrival.
Developers compressed the hazard maps into lightweight vector tiles so they would load on ordinary mobile devices. Each map update was packed into file sizes of roughly 250 KB to 800 KB, small enough to download over a thin connection without stalling. This constraint shaped the entire interface design.
Closing the Feedback Loop
The system depends on a return channel. Community observers submit ground-truth measurements using GPS-enabled smartpoles that record ice thickness at 5-inch intervals. Those measurements flow back to researchers, who use them to calibrate the SAR classification algorithms — correcting cases where, for example, wind-scoured ice produces low backscatter returns that the model mistakes for open water.
Community Ground-Truthing Protocol for SAR Ice Maps
- Verify GPS coordinates of the observation site against the provided SAR anomaly map.
- Record ambient air temperature and recent precipitation over the preceding 48 hours.
- Measure snow depth on top of the ice before testing thickness beneath it.
None of this works as a solo effort. The build brought together research institutes, tribal councils, and spatial data engineers, with each group holding authority over a different part of the pipeline — communities over what gets mapped and how it is governed, engineers over the processing chain.
Results: Enhancing Safety and Adaptation
Project leaders measured the tool by comparing its mapped safe routes against the actual GPS tracks of local hunters during the spring harvest season. The overlap was the point: where the maps and the experienced travelers agreed, the system was working.
During the 2021–2022 winter season, the mapping tool identified 14 distinct open-water leads that had previously gone unmarked. Each of those is a hazard a traveler can now route around before encountering it in the dark.
The efficiency gains were tangible as well. Routing adjustments based on SAR data reduced travel time across the Kuskokwim River by roughly 1.5 to 3 hours per trip — less fuel burned, less exposure, more daylight spent harvesting rather than detouring.
The deeper shift is one of posture. Communities moved from reacting to ice failure after the fact toward planning around it in advance, with data they helped produce and continue to govern.
That is the result that matters most: not a faster crossing, but a community working from foresight instead of vulnerability.
Scope and Limitations of Satellite Monitoring
A map is only as honest as its timestamp. Data processing and map generation introduce a latency of roughly 24 to 48 hours from the moment of satellite overpass, and ice conditions can change inside that window. Analysts therefore enforced a strict protocol: every layer carries an acquisition timestamp so users can judge for themselves how stale the information might be.
Resolution sets a second boundary. The SAR sensors used here resolve detail at about 10 to 30 meters per pixel. That is fine for mapping a major lead and useless for a thin patch a few feet wide buried under heavy snow. Micro-hazards slip through.
Risk Factor: SAR backscatter analysis struggles to differentiate between solid bottom-fast ice and suspended ice in shallow river channels less than 3 feet deep. Ice decay rates also vary sharply with local bathymetry and the presence of groundwater springs, so two stretches that look identical on radar can behave very differently underfoot.
Recommendation: Treat the spatial data as supplementary, never as a substitute for physical testing. Spudding ahead and reading the surface in person remain the final word. The map narrows where to look; it does not certify the ice. Reference datasets such as those maintained by the National Snow and Ice Data Center (NSIDC) help contextualize regional trends but cannot resolve conditions at the scale of a single crossing.
Conclusion and Key Takeaways
The pilot ran continuously from November 2019 through April 2022. Across those three winters, the consortium synthesized community feedback into a clear picture of what works: radar that sees through the polar night, paired with the judgment of people who have read this ice their whole lives, delivered through tools built for the networks they actually have.
Critical Insight: Neither satellite data nor traditional knowledge was sufficient on its own. The value came from binding them together — and from communities holding governance over the result.
The work is not finished. Future iterations aim to integrate L-band SAR to improve penetration through wet snow cover, addressing one of the clearest weaknesses surfaced during the pilot. As Arctic warming accelerates and the old baselines keep slipping, adaptive mapping cannot be a one-time deliverable. It has to keep pace with a river that refuses to freeze the way it used to.