Abstract
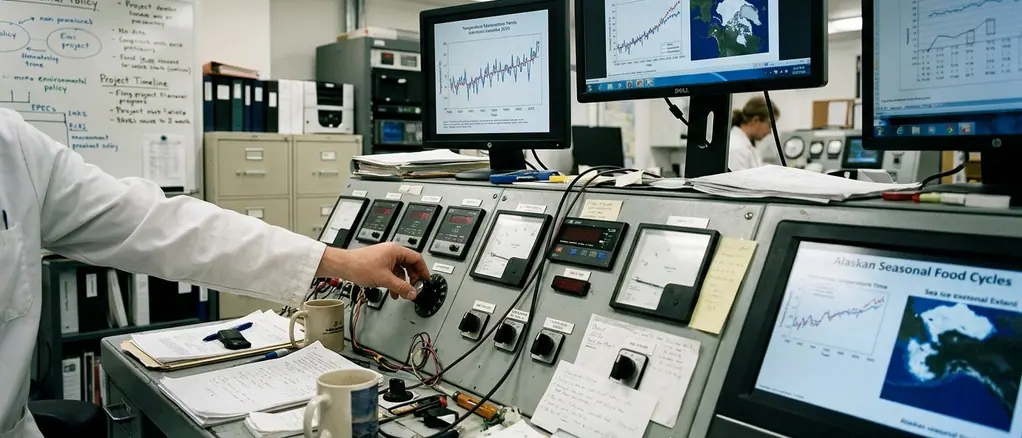
This analysis examines where spatial climate data meets traditional ecological knowledge (TEK) in the context of subsistence harvesting across rural Alaska. The objective was narrow but consequential: document how the timing of seasonal events now diverges from the calendars communities have followed for generations, and trace what that divergence means for the safety and yield of traditional food gathering.
An early framing considered quantitative temperature anomalies alone. That approach captured the physics but missed the people, so the work shifted to a dual framework pairing 15-meter resolution satellite imagery with localized harvest calendars across an observation period spanning 2018 to 2023.
The central observation is straightforward. Phenological shifts in the Arctic are accelerating, and they are altering both when food can be gathered and whether the journey to gather it is survivable. The conclusion is qualitative by design: shifting seasons demand adaptive management and localized spatial monitoring if food security is to hold.
Introduction: Climate Context in the Arctic
Alaska warms faster than the lower latitudes. High-latitude warming trends measured at roughly 0.25 to 0.30 degrees Celsius per decade compress the seasonal calendar, and that compression lands hardest on communities whose food systems are timed to ice, thaw, and migration.
Subsistence harvesting carries a specific legal meaning here. The research team aligned state subsistence definitions with the federal Title VIII provisions of the Alaska National Interest Lands Conservation Act, which recognize the customary and traditional uses of wild resources by rural residents. This is not a hobby category. Subsistence harvests yield an estimated 295 pounds of food per person annually in rural Alaskan communities, a figure that store shelves in off-road villages cannot easily replace.
The governing concept throughout is phenological mismatch. When the life cycles of flora and fauna shift their timing while the cultural and logistical calendars of harvesters remain anchored to historical norms, a gap opens. That gap is the subject of this report.
Methodology: Spatial Data and Community Observation
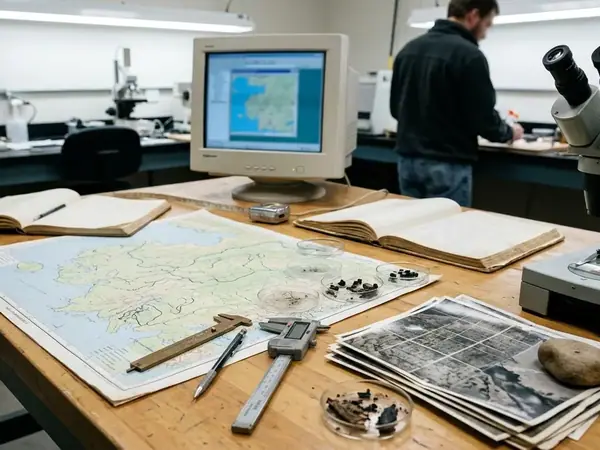
The study area covers roughly 45,000 square kilometers of the Yukon-Kuskokwim Delta, a region of coastal and riverine ecosystems that anchor regional hunting and fishing. Coastal margins and river corridors were prioritized because these are the surfaces communities travel and the habitats they harvest.
Tracking ice dynamics
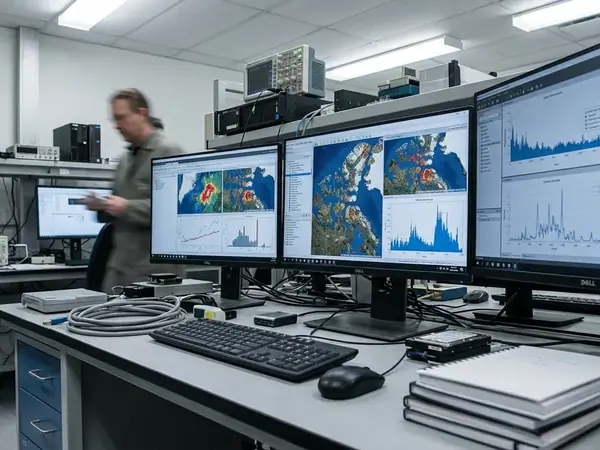
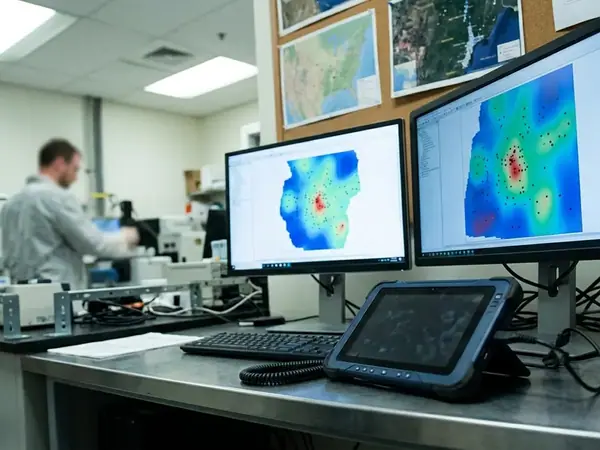
To map ice behavior, researchers layered Synthetic Aperture Radar (SAR) data over community-provided GPS waypoints marking historical hunting routes. SAR imagery was captured at 12-day intervals to monitor river ice decay, a cadence chosen because radar penetrates the cloud and darkness that defeat optical sensors. The result is a moving picture of breakup and freeze-up plotted directly against the trails people actually use.
Incorporating traditional ecological knowledge
TEK enters the framework as a primary data source, not a supplement. Community observers contributed route waypoints, seasonal timing notes, and condition reports, which were georeferenced against the satellite record. Where remote sensing showed a thinning ice edge, a hunter's account often explained why a familiar crossing had become unreliable. The two streams correct each other.
Key Findings: Phenological Shifts in Flora and Fauna
The clearest signal is the lengthening shoulder seasons. Across monitored spatial grids, spring thaw onset is occurring 9 to 14 days earlier than the 1990-2010 historical baseline, while fall freeze-up arrives correspondingly later. The frozen-surface window that enables overland travel is narrowing from both ends.
Migratory species and timing mismatch
Analysts cross-referenced telemetry data from collared migratory species against normalized difference vegetation index (NDVI) green-up metrics. The comparison surfaced timing mismatches: vegetation green-up advances while caribou movement and marine mammal presence shift on their own schedules, decoupling the arrival of animals from the periods when harvesters historically intercepted them. Routing changes follow the food, not the calendar.
Berry maturation
Native flora show the same forward drift. Peak berry maturation has shifted forward by a window of 11 to 16 days across coastal tundra zones. Berries are not incidental. They are a winter preservation staple, and a two-week shift can place peak ripeness against weather or competing harvest obligations that did not previously overlap.
Impacts on Subsistence Harvesting and Access
Thin ice kills. The assessment of travel hazards correlated ice thickness measurements with documented search-and-rescue deployment coordinates, and the relationship was direct. Minimum safe ice thickness for snowmachine travel sits at 15 to 20 centimeters; surfaces that read as solid under a dusting of snow now fall short of that threshold more often, and rescue deployments cluster where the radar record shows decaying ice.
Preservation is a second pressure point. Optimal air-drying windows for salmon have narrowed to 4 to 7 days before spoilage risks climb, driven by elevated ambient humidity during what should be reliable drying weather. A method that depended on predictable late-summer conditions now operates on a shrinking margin.
The economic burden of replacing subsistence foods varies drastically depending on a community's proximity to regional aviation hubs versus those requiring secondary marine transport.
Spatial displacement compounds both problems. As nearer grounds become unreliable, harvesters travel farther over terrain whose freeze and thaw they can no longer predict, trading known short routes for longer uncertain ones.
Socioeconomic and Nutritional Implications
When the harvest falls short, the gap is filled at the store, and the store is expensive. Economic impact models were built by calculating the freight costs of importing equivalent caloric values to off-road communities via bush plane. Replacement costs for traditional proteins reach roughly $8 to $14 per pound in remote village stores, and the imported substitute rarely matches the nutrient density of wild meat and fish.
The cost is not only nutritional. Disrupted harvesting seasons interrupt intergenerational knowledge transfer; when the timing of a hunt becomes erratic, the structured teaching that travels with it becomes harder to sustain.
Reaching displaced grounds also burns more fuel. Fuel consumption for hunting trips is increasing by about 3 to 5 gallons per excursion as travelers detour around degraded permafrost, a recurring cost layered on top of every other pressure.
Limitations and Scope of Spatial Analysis
The spatial analysis framework was constrained to optical and radar datasets, which forced manual interpolation during sensor blackout periods. Two blackout sources dominate.
- Polar night conditions limit optical satellite utility between late November and late January.
- Cloud cover obscures coastal monitoring grids for 40 to 60 days during the fall storm season.
Over-reliance on optical satellite imagery during the Arctic fall season often results in critical data gaps due to persistent coastal stratus clouds. SAR mitigates this, but it does not erase the interpretive work required to bridge the dark and cloudy stretches.
A further constraint is methodological. Converting qualitative TEK into standardized spatial datasets is delicate work, and the temporal record remains short relative to the multi-decadal trends it describes.
Risk Factor: The integration of Traditional Ecological Knowledge into GIS databases is inherently localized and cannot be extrapolated to regions lacking active community observation networks. Findings for the Yukon-Kuskokwim Delta should not be read as a uniform Arctic baseline.
Conclusion and Policy Recommendations
Shifting seasons are disrupting traditional food gathering across the study area, and the disruption operates on three fronts at once: when food is available, whether travel to it is safe, and what it costs to substitute when the harvest fails. Policy recommendations were drafted by synthesizing the spatial hazard maps with existing state wildlife management frameworks to locate where regulatory flexibility is most needed.
Two practical measures follow.
- Develop community-led, real-time spatial monitoring networks, including community-operated drone programs covering 5-kilometer radii around village perimeters, to improve travel safety where ice conditions change within days.
- Adopt 48-hour emergency harvest openings keyed to real-time ice and animal conditions rather than fixed calendar dates.
Critical Insight: Management calendars anchored to historical dates are increasingly mismatched against the conditions on the ground. Tying regulatory windows to observed phenology, and to the people watching it daily, is the more defensible path. These conclusions rest on a five-year window and a single delta region; they describe a strong local signal, not a settled regional law.
For broader climate context, the Arctic Report Card tracks the high-latitude trends that frame this work.