Abstract and Introduction
Interior Alaska’s fire record is not a single clean line on a map. It is a layered archive of pencil-drawn perimeters, agency reports, satellite scenes, incident records, and GIS edits made decades apart.
This article examines historical wildfire perimeters across Interior Alaska from January 1940 through December 2023. For this dataset, Interior Alaska is defined by a geographic bounding box spanning 61° to 68° N latitude and 141° to 160° W longitude. That frame captures the broad boreal interior between the Alaska Range, the Brooks Range foothills, the Yukon River corridor, and the eastern and western interior fire landscapes that repeatedly shape statewide fire seasons.
The objective is direct: use spatial data to understand how wildfire perimeters have changed over time. The record does not merely show where fire occurred. It shows how burn size, perimeter continuity, ignition geography, and post-fire landscape response have shifted across more than eight decades.
The research team initially considered limiting the analysis to the satellite era after 1972, when Landsat imagery introduced a more consistent observational base. That would have made the geometry cleaner. It also would have removed the critical mid-century baseline needed to compare contemporary fire patterns against older boreal fire behavior.
Critical Insight: The pre-satellite record is less precise, but excluding it would narrow the historical question at the exact point where long-term climate and land-cover comparisons need depth.
Longitudinal fire perimeter data now sits at the center of Arctic climate research, wildfire planning, permafrost studies, and boreal ecology. In Interior Alaska, a burned polygon is also a climate marker, a hydrology boundary, and often a subsistence access concern for nearby communities.
Spatial Data Collection Methodology
From field sketches to satellite-supported perimeters
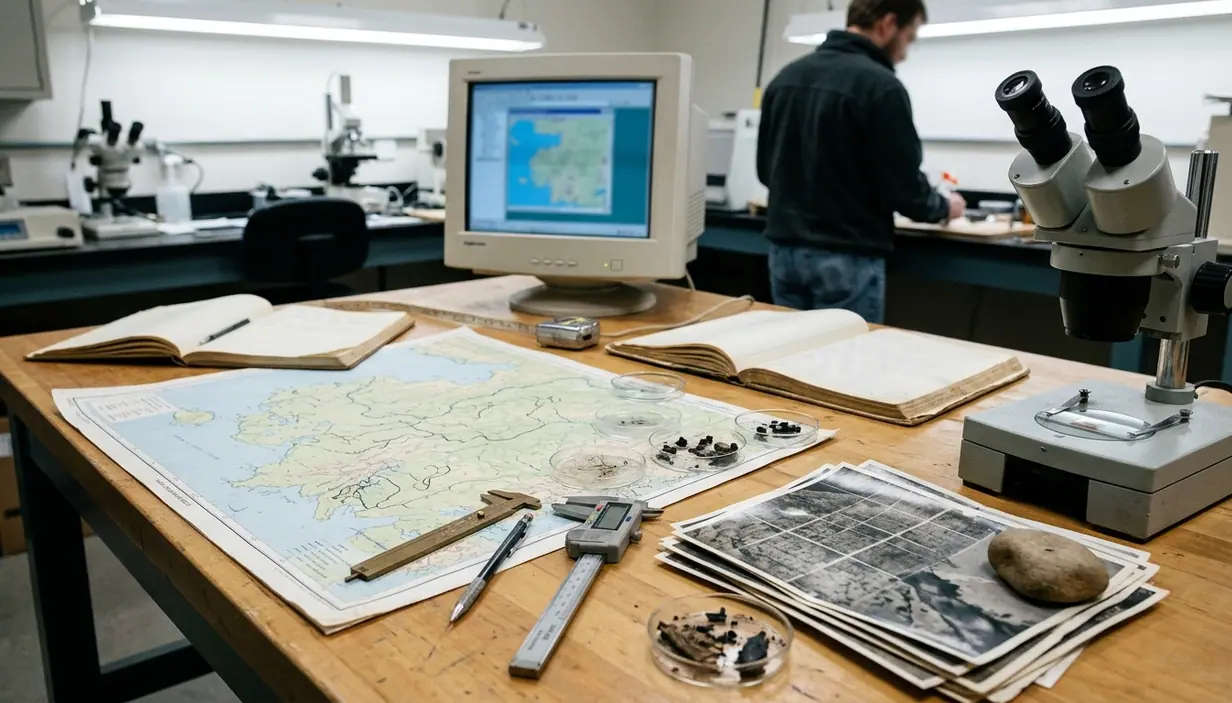
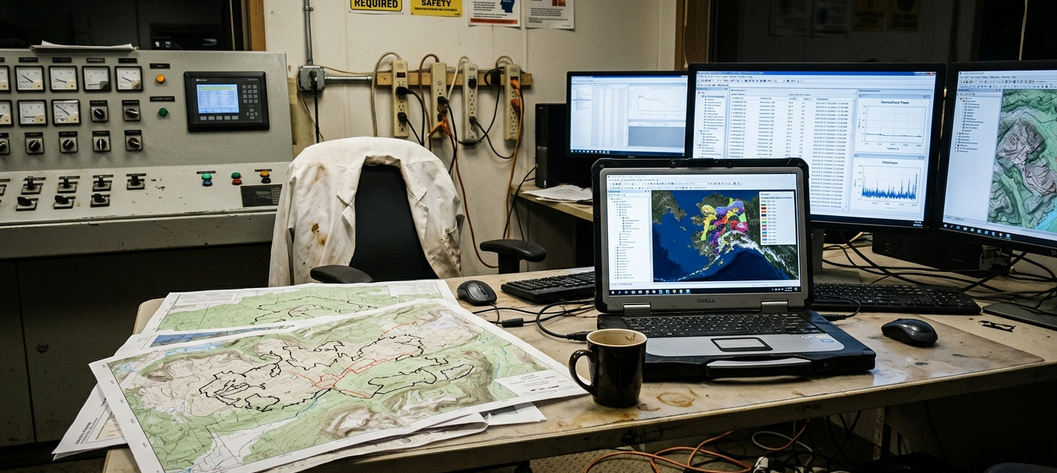
The oldest perimeter records in this compilation came from methods that were practical for their time: aerial sketch mapping, ground surveys, agency fire reports, and 1:250,000 scale USGS quadrangle paper maps. These sources often captured the right fire, in the right drainage, during the right season. They did not always capture the exact edge.
Modern perimeter mapping works differently. Landsat imagery, available at 30-meter resolution starting in 1972, introduced repeatable wall-to-wall observation. MODIS and VIIRS fire detections later improved near-real-time awareness of active fire growth, though those detections serve a different purpose than final perimeter mapping. GIS then provides the framework for aligning, comparing, and revising fire boundaries across decades.
The methodological bridge matters more than the software. A 1950s paper boundary cannot be treated as if it were drawn from a cloud-free Landsat scene. The workflow therefore separated source interpretation from geometric standardization.
Digitizing and standardizing legacy records
- Archival fire records were reviewed by source type, including paper maps, agency reports, and existing digital perimeter files.
- Legacy polygons were digitized or checked against available reference geography.
- Spatial data were standardized to the Alaska Albers Equal Area Conic projection, EPSG:3338, to reduce distortion across the Interior Alaska study area.
- More than 3,400 individual historical fire polygons were processed for longitudinal comparison.
- Perimeters were grouped by time period and source reliability before interpretation.
The standardized projection protocol was not a clerical choice. Equal-area comparison is central when the research question concerns changes in burn extent, perimeter contiguity, and overlap. A projection that distorts area across this latitude band would add unnecessary noise to an already mixed historical record.
For current official fire history geometry, the compilation aligns with the Alaska Interagency Coordination Center (AICC) historical fire data, updated through the 2023 fire season.
Key Findings: Evolution of Burn Patterns
Decadal cohorts reveal a change in fire geometry
The clearest pattern is spatial, not simply chronological. Interior Alaska’s historical record shows a qualitative shift from more isolated mid-century burn perimeters toward larger, more contiguous fire complexes in recent decades.
To evaluate that shift, the analytical framework grouped fire perimeters into decadal cohorts. This step helped separate broad spatial expansion from the year-to-year noise of individual fire seasons, lightning patterns, and suppression decisions.
In the 1950s records, isolated burns of roughly 5,000 hectares appear as common reference points in the mapped archive. By the 2000s, the record includes contiguous mega-fires exceeding 200,000 hectares. The difference is not only size. Larger recent perimeters also show more connected burn geometry across drainage divides, upland black spruce stands, and lowland mosaics that earlier records more often showed as separate fire events.
Recommendation: Compare Interior Alaska fire history by decade and source class before calculating reburn intervals. Direct polygon-to-polygon comparison across the full 1940–2023 period can hide major differences in mapping method.
Peak expansion and recurring ignition geography
The majority of recorded mega-fires reached their peak expansion window between mid-June and mid-August. That timing matches the practical fire-season reality in the Interior: long daylight, receptive fuels, lightning-driven starts, and weather patterns capable of pushing perimeters across large, remote landscapes.
Historical fire boundaries also cluster around recurring ignition zones. These are not always identical points on the map. They are broader landscapes where lightning occurrence, fuel continuity, access limitations, and prior burn history interact. Some past burns appear to shape later fire spread by altering vegetation structure; others leave corridors where new fires can still move through remaining spruce fuels.
The useful question is not whether a previous perimeter blocks the next fire. Sometimes it does. Sometimes it only changes the rate, direction, or severity of spread.
Environmental Context and Climate Impacts
Fire perimeters as climate-response boundaries
Expanding fire perimeters in Interior Alaska align with broader Arctic climate shifts, but the relationship should be handled carefully. A perimeter map records the final burned extent of a fire. It does not, by itself, explain the full weather sequence, fuel condition, suppression context, or ignition cause behind that extent.
Still, the perimeter archive provides a practical spatial record of landscape response. Larger, more contiguous burns increase the area where soils, vegetation, surface hydrology, and permafrost can reorganize after fire. In black spruce ecosystems, high-severity fire can remove insulating organic layers and expose frozen ground to warmer seasonal conditions.
Monitoring data, from longitudinal tracking, shows active layer thickening of roughly 0.5 to 1.2 meters within the first five years after ignition in black spruce ecosystems. That range is especially important in lowland areas where ice-rich permafrost influences drainage, ponding, and ground stability.
Permafrost, hydrology, and vegetation succession
When assessing post-fire vegetation succession, researchers cross-referenced burn scars with known permafrost distribution maps to isolate hydrological changes triggered by thaw. This step matters because the same burn perimeter can contain wet lowlands, well-drained slopes, unburned inclusions, and patches of very different pre-fire vegetation.
Context-dependent variation is large. Post-fire permafrost degradation rates vary drastically depending on whether the pre-fire ecosystem was dominated by black spruce with thick organic layers or well-drained deciduous stands.
Vegetation response follows the same logic. High-severity burns often shift early succession toward deciduous cover, especially birch and aspen. The observed timeframe for deciduous canopy closure after high-severity burns is around 15 to 25 years. That transition can reduce near-term flammability compared with dense black spruce regeneration, though it does not remove future fire risk.
Risk Factor: Treating a historical fire perimeter as ecologically uniform can mislead hydrology and habitat assessments. The boundary shows where fire occurred; severity, soil ice, and vegetation recovery determine what changed inside it.
Scope, Constraints, and Data Limitations
Where the early record loses precision
Pre-1970s fire perimeter mapping carries known spatial uncertainty. Aerial sketch maps and paper quadrangles were essential operational tools, but they were not built for modern pixel-level overlay analysis.
Spatial offset margins can reach up to roughly 2.5 kilometers in pre-1970 aerial sketch maps. In flat terrain, that uncertainty may still preserve the general fire footprint. In complex topography, it can shift a boundary across slopes, drainages, or vegetation types in ways that affect interpretation.
The most common failure case is straightforward: applying modern 30-meter spatial resolution assumptions to 1950s aerial sketch maps results in false-positive burn overlaps and inaccurate reburn interval calculations. The geometry looks precise because it sits inside a modern GIS. The source was never that precise.
Sensor thresholds and digitization artifacts
Satellite data also has limits. Sensor resolution can miss low-intensity or understory burns, especially when the affected area is small, patchy, or obscured by canopy conditions. The documented detection threshold limits the capture of understory burns smaller than about 10 hectares.
The team categorized spatial anomalies by source, separating errors caused by coarse early AVHRR sensor resolution from those introduced by physical degradation of legacy paper maps before digitization. Fold lines, faded ink, map stretch, hand-drawn generalization, and imperfect georeferencing can all move a boundary.
For this Interior Alaska compilation, the accuracy of pre-1972 perimeter boundaries degrades significantly in areas with complex topography. Spatial overlap analyses in steep terrain should therefore be treated as estimates rather than exact historical footprints.
- Most reliable use: regional trend analysis, decadal comparison, broad burn-history context.
- Use with caution: reburn intervals at fine spatial scales, edge-to-edge overlap, slope-specific ecological inference.
- Not recommended without review: parcel-level interpretation from early paper-derived perimeters.
Conclusion and Future Research
Why the 1940–2023 record still matters
The Interior Alaska historical fire perimeter dataset from 1940 through 2023 is foundational because it preserves both the long view and the operational detail needed for present-day decisions. It connects mid-century fire geography with contemporary satellite-era fire behavior.
Federal land management agencies now integrate the 1940–2023 dataset into predictive models used for wildfire planning and climate-related landscape assessment. Policymakers and land managers use these spatial records to evaluate where past fires may influence current fuel patterns, where communities face recurring exposure, and where mitigation work should account for previous burn scars.
This is not a guarantee of future fire behavior. It is a structured historical baseline. In a boreal region where fuels, permafrost, and access conditions are changing together, that baseline helps keep current decisions tied to evidence rather than memory.
Next research priority: unburned islands
The next practical step is higher-resolution mapping of unburned islands within historical perimeters. These refugia can preserve seed sources, wildlife cover, cultural resources, and cooler microsites inside otherwise burned landscapes.
Future work is already pointed toward a 2024–2026 phase of refugia mapping using LiDAR. That effort should help separate truly unburned islands from low-severity burned patches that earlier perimeter datasets often grouped together. It should also improve burn-severity interpretation inside large contiguous fires, where a single outer boundary can conceal substantial internal variation.
Critical Insight: The most useful future fire-history products will not only redraw outer perimeters. They will map what survived inside them.