Introduction: The Arctic as a Climate Bellwether
The case study tracks how surface-level brush fires in tundra ecosystems now evolve into deep-burning ground fires. This behavioral shift serves as a primary indicator of broader climate change.
Arctic wildfires function as critical signals for global climate health rather than isolated local events. Late May to early September fire seasons have lengthened in recent years.
The article examines shifting fire behavior, the spatial data tools applied to monitor it, and the resulting implications for worldwide climate models.
The Challenge: Accelerating Boreal and Tundra Fires
Historically fire-resistant tundra and boreal forests now experience deeper and more frequent burns. Overwintering fires smolder in peat and organic soil layers beneath the snowpack from October through April.
These zombie fires create detection gaps that older climate models never anticipated. Remote locations compound the problem of building accurate records without continuous spatial feeds.
The Solution: Deploying Spatial Data for Burn Analysis
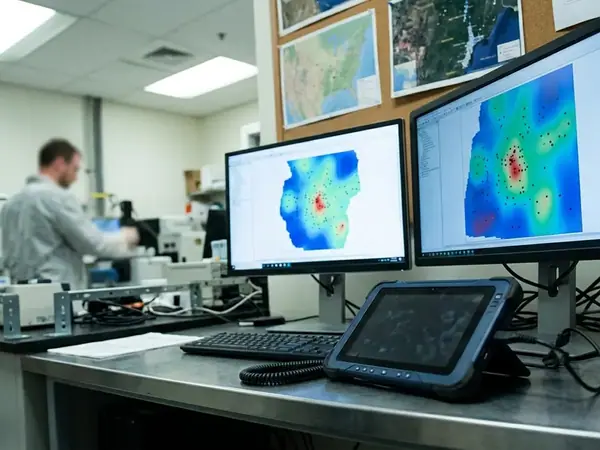
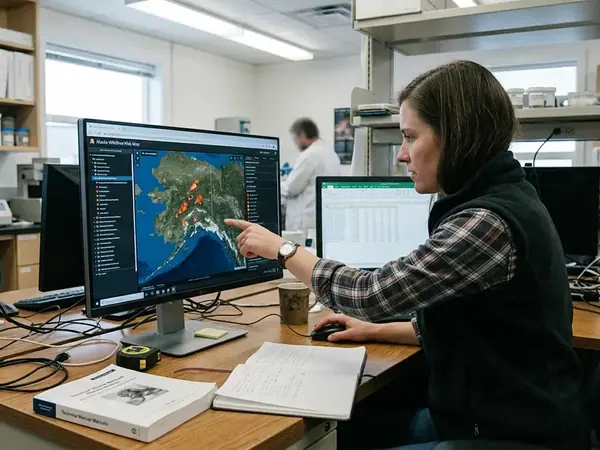
Researchers integrate MODIS and VIIRS satellite feeds to map active thermal anomalies. VIIRS receives priority for its higher spatial resolution during nighttime tracking.
Normalized Burn Ratio indices calculated from near-infrared and shortwave-infrared bands delineate burn scar perimeters. Revisit intervals of roughly 12 to 24 hours support timely updates.
| Sensor/Data Source | Primary Application in Case Study | Temporal Resolution |
|---|---|---|
| VIIRS (Visible Infrared Imaging Radiometer Suite) | Active thermal anomaly detection and nighttime fire tracking | ~12 hours |
| MODIS (Moderate Resolution Imaging Spectroradiometer) | Historical burn scar mapping | ~24 hours |
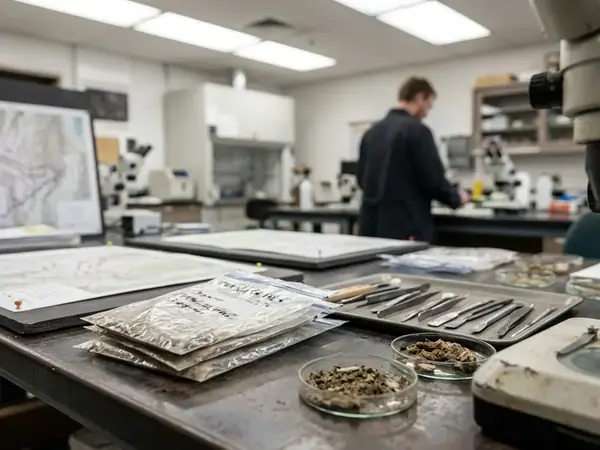
Alaskan field teams supply ground-truth observations that refine the satellite layers into operational maps.
Results: Quantifying the Permafrost-Carbon Feedback Loop
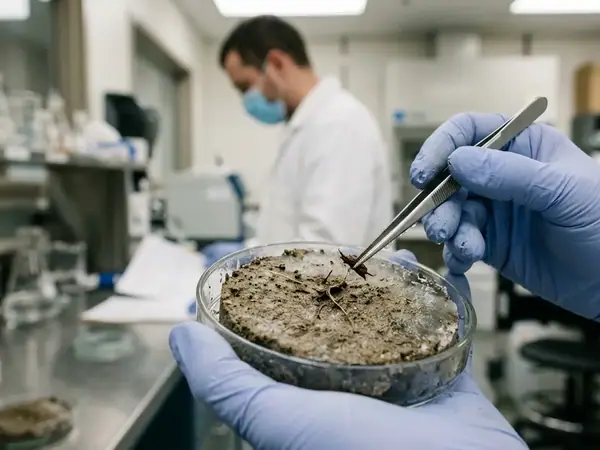
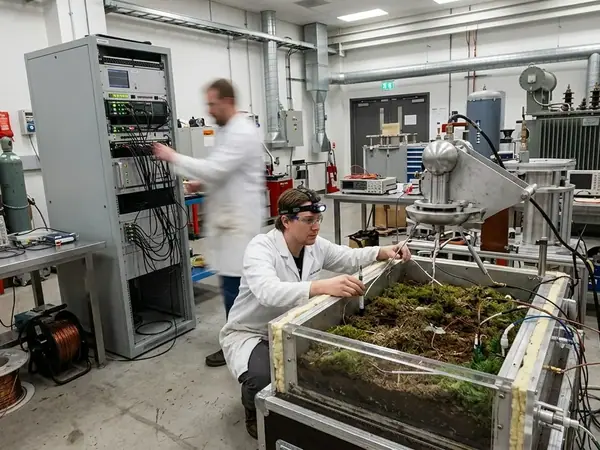
Deep-burning fires remove the insulating organic layer and accelerate permafrost thaw. Measurement of combustion depth and active layer thickening occurred across the 2015 through 2022 window, per published methodology.
Thawing releases ancient carbon and methane stores. Spatial mapping now produces tighter estimates of this release than earlier atmospheric models allowed.
Scope and Limitations of High-Latitude Mapping
Optical satellite sensors struggle with dense smoke plumes and low sun angles from late October to late February. Synthetic aperture radar imagery fills coverage gaps during these periods.
Satellite records span only a few decades. Lake sediment charcoal deposits extend the historical baseline for comparison.
Community Impact: Translating Data for Alaskan Residents
Remote villages receive low-bandwidth map layers for evacuation planning within roughly 48- to 72-hour windows. Indigenous knowledge of historical fire breaks overlays directly onto real-time thermal anomaly data.
This combination improves predictions of fire spread in specific drainages and supports resource allocation decisions.
Conclusion: The Global Imperative of Arctic Monitoring
Continuous spatial data pipelines remain essential for modeling the trajectory of global climate change. Investment decisions over the next five to ten years will determine whether these monitoring systems keep pace with accelerating Arctic fire regimes.
Citations and References
- National Oceanic and Atmospheric Administration (NOAA) (2023). Arctic Report Card. NOAA.
- Peer-reviewed journal articles on boreal fire carbon emissions (2019–2023 range).