Across Alaska’s interior and Arctic margins, a lightning strike can land far beyond the nearest road, airstrip, or reliable line of sight. The ignition may remain small for days, spread beneath the surface, or emerge as a fast-moving front after weather conditions change. When that strike goes unlocated, remote communities face a narrower window for protecting travel corridors, cabins, and subsistence & access routes.
The mapping problem reaches beyond immediate response. Incomplete ignition records distort historical wildfire perimeters, weaken estimates of burned acreage, and leave climate models with an uncertain account of where carbon moved from vegetation and soil into the atmosphere.
Contents
- Why Remote Arctic Ignitions Change the Map
- From Dry Downdraft to Hidden Duff Fire
- How VLF Sensors and Satellites Share the Watch
- Warmer Surfaces Raise the Convective Ceiling
- One Tundra Strike Can Unfasten Permafrost
- Academic Sources
Why Remote Arctic Ignitions Change the Map
A research team examining Alaskan ignition patterns initially considered concentrating on human-caused fires near settlements. That approach offered clearer incident records and easier field verification. The team ultimately prioritized lightning because remote strikes account for the vast majority of untracked acreage burned in the Alaskan interior.
That decision changes how a wildfire map is built. A settlement-centered map follows roads, structures, dispatch reports, and known points of human activity. A lightning-centered map must account for atmospheric conditions, sparse observations, uncertain ignition times, and fires that surface far from the original strike coordinate.
Mapping the Seasonal Exposure
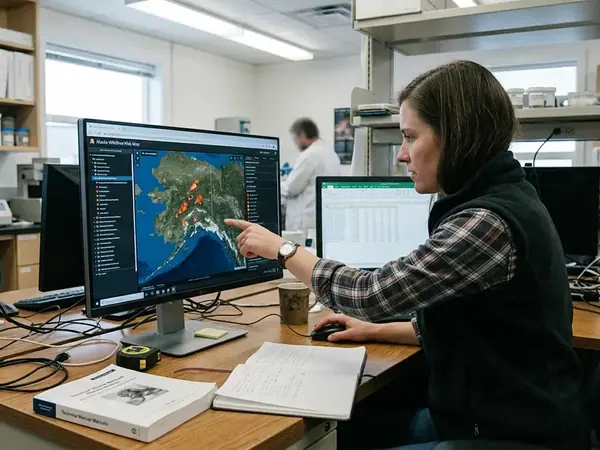
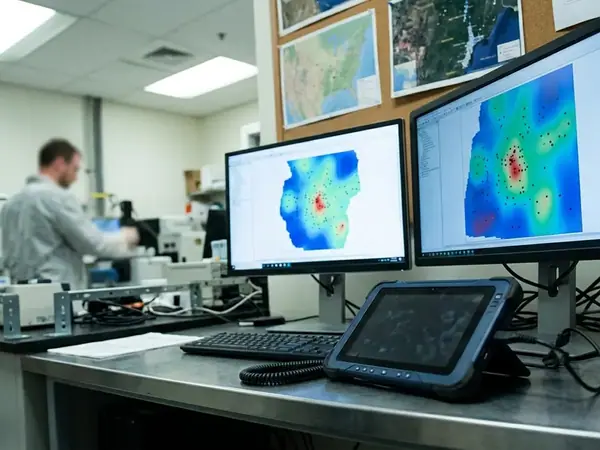
Analysts deployed spatial grids at 12-kilometer resolution to map ignition probability across the Alaskan interior from June 1 through September 15. The grid provides a consistent unit for joining lightning observations with fuel conditions and mapped fire perimeters. It also prevents a dense cluster of observations near populated areas from defining the apparent pattern for the entire region.
Far northern storms can develop and move quickly as surface heating, moisture, and wind profiles shift. Lightning therefore acts as an irregular driver of landscape change: a storm may cross an immense area, yet only a few cloud-to-ground strikes encounter fuels dry enough to sustain combustion.
Remote-Acreage Risk: A blank grid cell does not establish the absence of lightning. It may identify a place where atmospheric activity, sensor coverage, and field reporting have yet to be reconciled.
For communities, this distinction has practical weight. A mapped ignition probability surface can guide where analysts review satellite scenes, where crews check reports from local observers, and where planners examine possible disruptions to river travel or overland access. The map becomes an allocation tool as well as a historical record.
From Dry Downdraft to Hidden Duff Fire
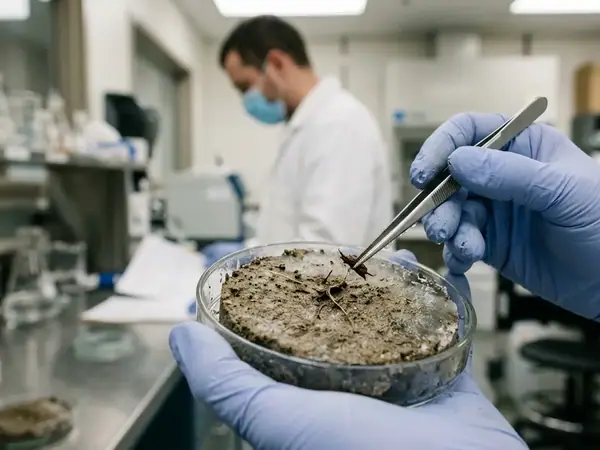
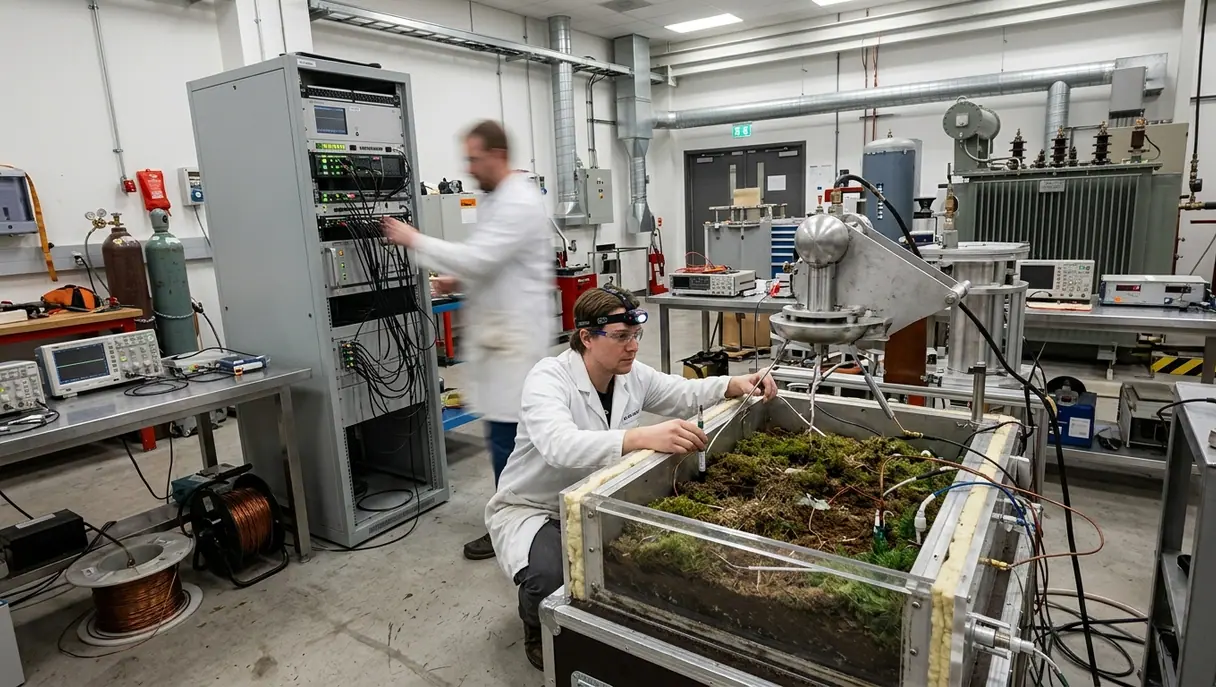
The critical measurements sit below the black spruce canopy. Analysts monitoring boreal ignitions separated the moisture response of trees and surface fuels from the behavior of deep organic duff, then measured subterranean peat smoldering temperatures at depths of 20 to 40 centimeters.
Those depths matter because a convective storm can deliver lightning while producing little effective rainfall at ground level. Evaporation beneath the cloud base and dry downdrafts can leave black spruce stands exposed to strong, erratic winds. Resinous branches, needles, and fine surface material provide receptive fuel around the strike point.
The Holdover Sequence
A holdover fire unfolds in stages that ordinary perimeter mapping can miss:
- A cloud-to-ground discharge transfers enough energy to ignite vegetation or organic soil near the strike channel.
- Combustion moves into duff or peat, where oxygen is limited and visible flame may disappear.
- The material smolders below ground while surface indicators remain faint or intermittent.
- Drying weather or wind increases oxygen flow, allowing heat to return to surface fuels.
- The fire becomes visible as an active wildfire, potentially well after the original storm has left the area.
The observed holdover interval extended from 12 to 28 days. That span separates the atmospheric event from the incident report by enough time to complicate causal matching. A fire detected in clear weather may still belong to a storm sequence several weeks earlier.
Subterranean peat smoldering depth parameters therefore belong in the ignition record alongside strike time, fuel class, and surface moisture. Treating deep duff as an extension of surface fuel can obscure the mechanism that kept the fire alive.
This is where field notes and mapping tools meet. A coordinate alone records location. A useful holdover record preserves the likely strike window, the depth interval examined, and the later emergence point so analysts can distinguish underground persistence from rapid surface spread.
How VLF Sensors and Satellites Share the Watch
Ground networks and orbital instruments observe different signatures of the same storm. Neither view should be treated as interchangeable.
Ground-based very low frequency receivers detect electromagnetic pulses associated with lightning. From 2019 through 2022, receivers were calibrated specifically for pulses from cloud-to-ground strikes. These detections help narrow the location and timing of discharges capable of reaching surface fuels.
By comparison, satellite-based optical transient detectors observe brief flashes from orbit across broad and difficult terrain. Their spatial reach is especially useful where installing and maintaining ground equipment is impractical.
When Each Detection Method Wins
- VLF networks win on continuity when an orbital platform is outside its observation window or cloud cover blocks the optical signal.
- Satellite instruments win on geographic reach across remote areas with sparse ground-sensor geometry.
- Combined records win on dispatch confidence when a cloud-to-ground pulse, an optical event, and a receptive fuel zone align in space and time.
The mapping division integrated both streams to maintain coverage during orbital gaps. Timestamp normalization comes first, followed by spatial matching and a review of nearby fuels and known fire activity. Duplicate observations remain linked rather than discarded because each sensor contributes different evidence.
Cloud-Cover Check
Dense stratocumulus over remote Alaska can delay real-time optical detection. Ground-sensor corroboration may be required before aerial reconnaissance is dispatched.
This is the necessary qualifier on expansive satellite coverage. Orbital observations extend the watch area, but heavy clouds and gaps between passes can interrupt the real-time picture. A field labeled Brooks Range optical transient detection threshold, for example, needs its sensor source, observation window, and corroboration status retained in the dataset; the label by itself cannot establish that a strike reached the ground.
The strongest operational map shows uncertainty directly. Analysts can separate confirmed cloud-to-ground strikes from optical-only observations and unresolved clusters, allowing dispatch staff to judge what kind of verification the record supports.
Warmer Surfaces Raise the Convective Ceiling
Lightning frequency at high latitudes begins with atmospheric instability. As a surface warms, rising air can gain buoyancy relative to the surrounding atmosphere. Where moisture and vertical temperature structure permit, that buoyancy supports deeper convection and the charge separation needed for lightning.
Climatologists incorporated Convective Available Potential Energy, or CAPE, into high-latitude atmospheric models covering 1990 to 2015. CAPE provides a structured way to represent the energy available to an ascending parcel of air. It does not identify the next ignition coordinate, but it helps map environments in which convective storms are more likely to form.
Reading Change Without Flattening Geography
Regional temperature increases can shift areas that historically experienced limited lightning toward more frequent convective conditions. The resulting pattern will follow terrain, moisture, and seasonal heating rather than a simple northward line. Mountain barriers can redirect storm development, while coastal cloud layers may suppress surface heating in one place as inland basins warm nearby.
For wildfire data, the practical unit is the overlap among instability, a cloud-to-ground strike, and receptive fuel. Increased storm frequency alone does not produce a corresponding fire perimeter every time. Wet fuels can extinguish an ignition, rain can accompany a strike, and some discharges never reach the ground.
Analysts adjusted thermodynamic instability thresholds within regional models to reflect increased convective storm frequency associated with rising surface temperatures. Historical calibration is central here. A threshold developed around lower-latitude storm behavior can misclassify a northern atmosphere whose moisture profiles, freezing levels, and seasonal daylight differ.
The resulting layers can support comparisons across fire seasons without implying false precision. They also give communities a way to place current lightning clusters within a longer record of climate impacts and changing exposure.
One Tundra Strike Can Unfasten Permafrost
A tundra ignition alters more than the vegetation visible at the surface. The organic layer above permafrost insulates frozen ground from summer heat. When fire consumes that layer, the ground receives more energy and the seasonally thawed active layer can deepen.
Field researchers used active layer detachment slides as the primary proxy for post-fire permafrost thaw. These slides occur when thawed near-surface material moves over still-frozen ground, leaving a spatial signal that can be mapped against burn boundaries and terrain.
Following the Ground After Flame
- Analysts place the lightning ignition within the mapped fire perimeter.
- Burned and less-affected ground are compared through the condition of the organic cover.
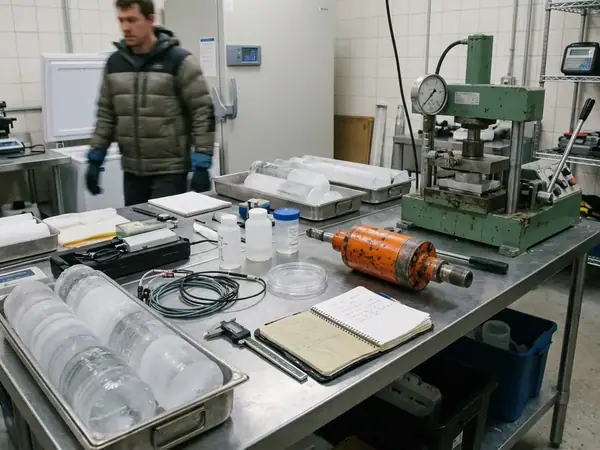
- Soil cores record degradation of that insulating layer and changes in active layer thickness.
- Mapped detachment slides identify where thaw has translated into terrain movement.
- Later observations track subsidence and changes that may affect drainage or access.
The physical sequence connects ignition mapping to carbon accounting. Frozen soils can retain organic carbon while temperatures remain low. Fire removes part of the insulating cover, thaw accelerates, and previously frozen material becomes available for decomposition. The terrain shifts from storing carbon under frozen conditions toward releasing it through active biological processes.
For subsistence & access mapping, the same process can reshape wet ground, drainage channels, and established travel surfaces. The visible burn scar marks only the opening phase. Ground stability may continue changing long after smoke disappears.